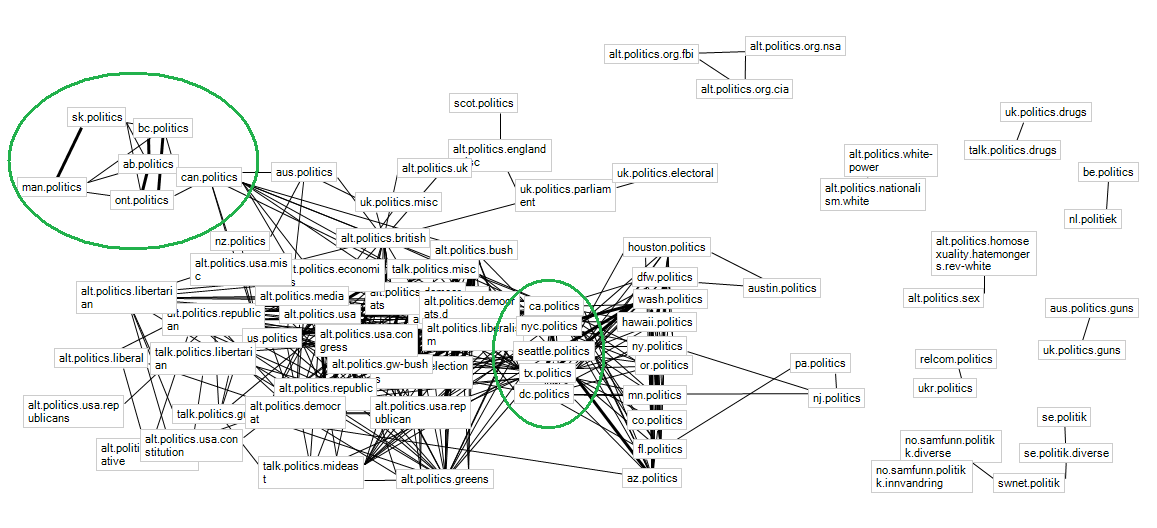
Using Marc Smith's .Netmap plug-in for excel, I visualized some data I had. These are shared authorships of political Usenet groups, based on Jaccard coefficient (similar to cosine similarity). A thin edge indicates a coefficient > 0.3, a thick edge indicates >0.5.
The alt.politics.* and talk.politics groups were a tangled mess that's nearly a clique, but there is some interesting behavior with local groups. In the top left are the Canadian local groups. Quebec's qc.politique doesn't appear at all in this graph (nodes are only visible if there is an edge associated), probably due to language barrier. Then, we have Saskatchewan and Manitoba connected with a thick edge, and British Columbia, Alberta, and Ontario connected with thick edges. Only the latter group is connected with can.politics, the general Canada group. Looking at the Canadian map it isn't regional since ONT is east of SK and MAN. However, there is something that does correlate the groups: population density. The group of three has a higher population, and a significantly higher population density, than the group of two. What comes with that is a higher-traffic local group, and more authors with which to share with even larger groups-- giving a higher coefficient.

The same thing may be happening with the US local groups, too. I've circled the "connected" US groups-- that is, the ones that share lots of authors with the alt.politics.* group. What's interesting is that these high-traffic groups form a bridge between alt.politics.* and the other local US groups. Several of these statewide, lower-traffic groups share authors amongst themselves, but with only a couple exceptions, they don't venture outside the local politics sphere. And again, there are some that don't show up here (most notably Virginia and Maryland-- I would imagine their nearest neighbor would be dc.politics, but they didn't have enough volume to get a high share-rate).
Just some cool-looking effects of the Jaccard index. I think another interesting way to visualize this might be to use a digraph, with an arrow from A to B if "p% of A's authors post in B". I bet that would get Virginia and Maryland to show up.
No comments:
Post a Comment