Showing posts with label psmr. Show all posts

Sunday, August 1, 2010

Why can't we be journal-driven like real scientists?

Disclaimer: I have been in the depths of thesis-draft writing, so I believe that around 60% of my angst is an extremely acute case of senioritis. However, the other 40% is founded on actual frustrations with academia, which I am working on articulating bit by bit.

-------

I just got back from my last conference as a grad student. There were several papers I thought were really neat, some great talks, and lots of fun people to hang out with, which definitely made it worthwhile. But conferences have their share of frustrations (which led to me tweeting, at one point, "Academic conferences should provide more of a venue for punching people in the face".) I think some of these frustrations would be less significant if CS were journal-driven like almost any other field.

This has been well articulated by Lance Fortnow in "Time for Computer Science to Grow Up" (pdf). He reasons that the quality of publications would increase if we moved completed research to journals, and that using conferences as endpoints simply detracts from the main purpose of conferences: to bring people together. I'm not sure about the former, since others have pointed out to me that some flaws he mentions (biased reviewers, overspecialization, sloppy pre-deadline rushes, publish-or-perish, etc.) exist regardless of publication model. But, I think there are some things to be said for modifying the model just so conferences will be more fun.

And I'm way more concerned with how much fun our field is than its publication quality.

Most conference talks suck. It takes a huge amount of time to make a quality presentation, and there's little incentive to do so. Unless your talk is just plain offensive, the worst outcome for a thrown-together presentation is that people will forget it. For posterity, there's a good chance the line on your CV for the publication is all that matters. Yet, if you get a paper in a conference you're typically required to give a talk, so we end up with a lot of mediocrity. (Panos Iperiotis proposed having peer-review for talks, which sounds great in theory, but good luck finding enough people for that review committee.)

Poster conferences like NIPS avoid a lot of that, but conference attendance is expensive. And it's a shame that people should have to pick what publication to submit to based on where they can get travel visas.

Journal-driven fields treat conferences like our (less-well-attended) workshops, which seems more appropriate. CS conference talks leave little room for discussion. Difficult questions are typically perceived as an attack, tabled with "That's a good question! Let's discuss this offline". After all, the paper has already been published in essentially final form-- what's the point in arguing with the authors except to make yourself look smart? Furthermore, if one does have a significant issue with a paper that they'd like to address in the public forum, there's no "letters to the editor" section as in several journals. There's only Open Mic Night, and most of the audience is either checking email or leaving to go see a talk in a different track.

I'm sure there's a joke about how the super-introverted CS crowd wouldn't go to conferences unless they had to. But overall, I think the conference as the end point of publication creates a high-pressure situation that detracts from the open forum it should be, and makes attendees less sociable.

In lieu of changing the model, I would advocate each conference having a Punch-People-In-The-Face Plenary Melee.

Saturday, September 26, 2009

Machine Learning Protest at G20

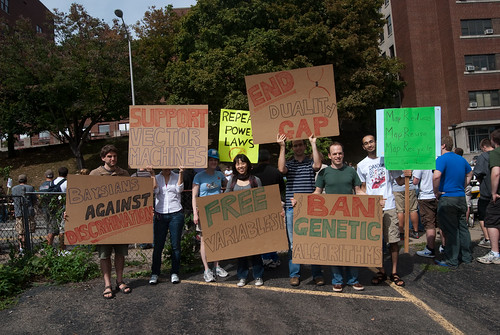
I have returned to the blogosphere to report on our successful voicing of machine learning concerns at the G20 People's March yesterday.


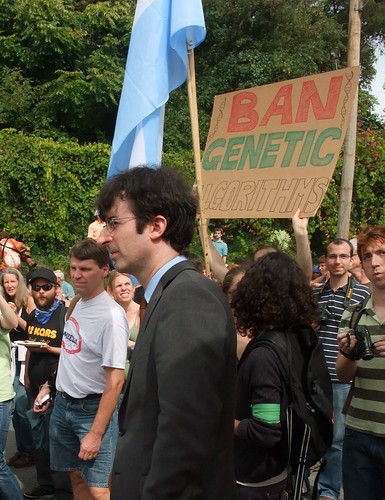
(Top: "Support Vector Machines," "Repeal Power Laws," "End Duality Gap," "MapReduce, MapReuse, MapRecycle: Green Data Processing." Bottom: "Bayesians Against Discrimination"," "Free Variables," "Ban Genetic Algorithms")


Several CMU SCS grad students and postdocs gathered at CMU and walked to Oakland where the march was to begin. As we carried our signs the LOL:Puzzlement ratio decreased (but by no means disappeared) as the distance from CMU increased. Then we marched with the crowd towards dahntahn.


John Oliver of the Daily Show showed up.


At some point we realized we were walking in front of the United Steelworkers team, who were all wearing the same hard hats as me (my friend having snagged mine from the USW booth at Netroots Nation last month). Here I am with a USW comparing causes.


All in all it was a success. For full set of pictures, go HERE.

For publications related to machine learning activism, see "Data Mining Disasters: A Report" [pdf], from SIGBOVIK 2008; and "MapReuse and MapRecycle: Two More Frameworks for Eco-Friendly Data Processing" [pdf], of SIGBOVIK 2009.

Sunday, September 7, 2008

The popular get richer

Pardon the hiatus; I have been busy at KDD and moving back to Pittsburgh (which included a 4-day scenic drive across the country).

In the spirit of the season I've been looking at a large dataset of campaign donations, from 1980 to 2006. This data is free to the public from the FEC; I've parsed and made it available on my website.

One can form a bipartite graph of committees (such as the Underwater Basketweavers' Political Action Committee) and candidates (such as Abraham Lincoln). Individual donations are all filtered through committees (usually a candidate has one or several designated committees), so the organization-candidate graph is the best way to measure donations to specific candidates.

A surprising observation in our KDD paper was the "fortification effect". First, if one takes the number of unique edges added to the graph (that is, the number of interactions between orgs and candidates) and compares with the total weight of the graph (that is, the total $ donated), one finds super-linear behavior. That is, the more unique donor-candidate relationships, the higher the average check becomes. The power law exponent in the org-cand graph was 1.5. (This also holds for $ vs nonunique edges, or number of checks, with exponent 1.15).

Even more interestingly, if one looks closer into the individual candidates, similar behavior emerges. The more donors a candidate has, the higher the average amount received from a donor becomes. The plot below shows money received from candidates vs. number of donor organizations.


Each green point represents one candidate, with the y-axis being the total money that candidate has received, and the x-coordinate being the number of donating organizations. The lower points represent the median for edge-intervals, with upper quartile error bars drawn. The red line is the power law fit-- here we have super-linear behavior between number of donors and the amount donated (with exponent 1.17). And again, the same is true for non-unique donations-- the more checks, the higher the average check.

Again, this does not include the 2008 data. I hear that Obama's donation patterns are different (lots of little checks, they tell me), but haven't confirmed this yet.

Wednesday, August 27, 2008

KDD 2008 <3's social networks

KDD this year put a lot of focus on social networks research. In addition to the long-running WebKDD, there was SNA-KDD (produced "Snack DD". Or at least it should be.) The Matrix and Tensor Methods workshop also included a paper featuring graph mining, and of course matrix methods in general are important for SNA. There were also two relevant tutorials I plan look over, now that I have the proceedings: Neville and Provost's Predictive Modeling with Social Networks, and Liu and Agrawal's "Blogosphere: Research Issues, Applications, and Tools."

And so far I've only listed SNA-related things going on first day. The Social Networks research track session was completely full: all seats taken, people crammed into the aisles, and overflowing into the hall. It was unfortunate that there were several people who just couldn't get in, but it was a lot of fun for the speakers to have such a great audience. There was also a panel on social networks, featuring Backstrom, Faloutsos, Jensen, and Leskovec. The conference took a cue from the overflowing session and switched it to a bigger room. (Unfortunately, it was scheduled at the same time as some other regular sessions that didn't receive the audience they might have were they only paired with other sessions.) There was an industry track session also devoted to social networks, and other relevant papers were in the Text Mining and Graph Mining sessions.

It's pretty exciting that social networks research is getting so much more attention, even in the last year. It will be interesting to see how long it lasts, and what sort of Big Questions get answered.

Time to board. It looks like the plane back to Seattle is mostly full of a different kind of geek: PAX attendees.

Tuesday, August 19, 2008

Butterflies in Vegas

I'd like to take this opportunity to self-promote our talk, "Weighted Graphs and Disconnected Components", at KDD 2008 next week in Las Vegas. This is work from CMU, with Leman Akoglu and Christos Faloutsos. In it we look at some commonly overlooked features of social networks: "disconnected components", or the components that are not connected to the largest connected component; and weighted edges, edges formed through repeated or valued interactions. We also propose the "Butterfly model" to generate graphs that match some of these new properties, along with previously-established graph properties.

For those planning to attend KDD, it will be the third in the Social Networks Research session, on Monday morning (with a poster Monday evening). Even if I haven't convinced you to attend our talk, you will want to see the other talks in the session (one of which is reviewed by Akshay Java here). They'll include the usual suspects from Yahoo! Research and Cornell, plus a paper analyzing of Sprint's call network. It should be a fascinating couple of hours!

Monday, August 18, 2008

Usenet vs blog linking in the 2004 election

As a historical study, I've taken a subset of the political Usenet links and compared to blog links in the same time period. I took links from October-November 2004 and made "A lists" for both political and conservative blogs, and compared with the A-lists found by Adamic and Glance in 2004.

Conservative A-List


Liberal A-List


I did little in the way of pruning the list, while Adamic and Glance were careful to only include traditionally-formatted blogs, but I have removed ones they explicitly mentioned omitting. As in their study, I've left off drudgereport (originally #2 in conservative) and democraticunderground (originally #1 in liberal), as they were not "weblogs" in the traditional sense-- drudgereport is an aggregator and democraticunderground is a message board. freerepublic.com is also message board-like, so that might have warranted removal from the list as well, but it was not mentioned in the paper. Bluelemur also claims to be the liberal version of drudgereport, (ETA: and realclearpolitics is another news aggregator) so those might also have been eliminated from the original study. Gadflyer.com, #2 in Liberals, is no longer in existence, which is interesting in itself, considering its popularity just a few years ago. But it is also notably missing from the Blog A-list, either by the numbers or by classification.

It is perhaps curious that blog-message boards democraticunderground and freerepublic have topped both lists in Usenet, which is closer to message board format. I wonder where they actually ranked on the pre-pruned blog list.

My overall impression from looking at this data is that Usenet is "edgier"; we more commonly see conspiracy theories and wingers getting a lot of attention. Given that, and the apparent popularity of message-board-like blogs, I wonder if we could consider the Usenet to be even more "democratic" (or "ruled by the mob", to be more cynical) than blogs.

Thursday, August 14, 2008

Preferential Installation of Facebook Apps [SIGCOMM WOSN]

I'm reading over the proceedings of SIGCOMM's Workshop On Social Networks, which is in Seattle next Monday.

Minas Gjoka, Michael Sirivianos, Athina Markopoulou, and Xiaowei Yang, a team of authors at UCI, wrote a paper, Poking Facebook: Characterization of OSN Applications, which looks at data from Facebook application installation and use.

First, they seem to have gotten a pretty successful crawl, which is saying something since Facebook is pretty selfish with data. Here is a PDF of application installation, both according to facebook stats and their crawled dataset, which match up pretty well:
They also modeled the histogram of installed-apps-per-user as preferential, running a simulation with "users as bins" and different apps as "different colored balls", iteratively assigning balls to bins. For instance, saying that 100 users have installed the Zombies application, would translate to "gray balls appear in 100 bins".

For each iteration, one goes through each "ball" (application installation), starting with the "most popular color" (application with the most installations). For each ball one then assigns an additional "bin that doesn't already contain that color" (picks a new user that hasn't already installed the app) according to a probability:


Where balls(i) is the number of applications a user i has installed, and B is the set of users that hasn't already installed the application. init is a parameter to moderate the initial activity, and rho is the preferential exponent, chosen in simulations to be 1.6. In the end you get a sort of heavy-tailed behavior, with most users installing a couple apps and a few who go nuts with application installs. It fits pretty well:


One of the fun parts of these sort of data is the outliers-- the users who go nuts on something. (Netflix users rating thousands of movies, etc.) It looks like in the crawled data there are a few users with 500 apps installed!

In the paper there is also fit to the "coverage of applications"-- that is, how many of the ranked apps we need to go through before we have all the users with one of those apps installed, and it appears the simulation reaches coverage a little too quickly, so perhaps the most popular applications are taking too many users in the simulation.

What's somewhat surprising to me is that this isn't at all based on the behavior of a user's friends, but of the entire Facebook network at large. I suspect that in reality that does govern user behavior, but for large-scale patterns one can overlook it. This might be different for actually modeling how an application catches on. (Using other features like network effects are listed as "future work" for the authors in refining the model.)

Tuesday, August 12, 2008

Shared authors in the political Usenet

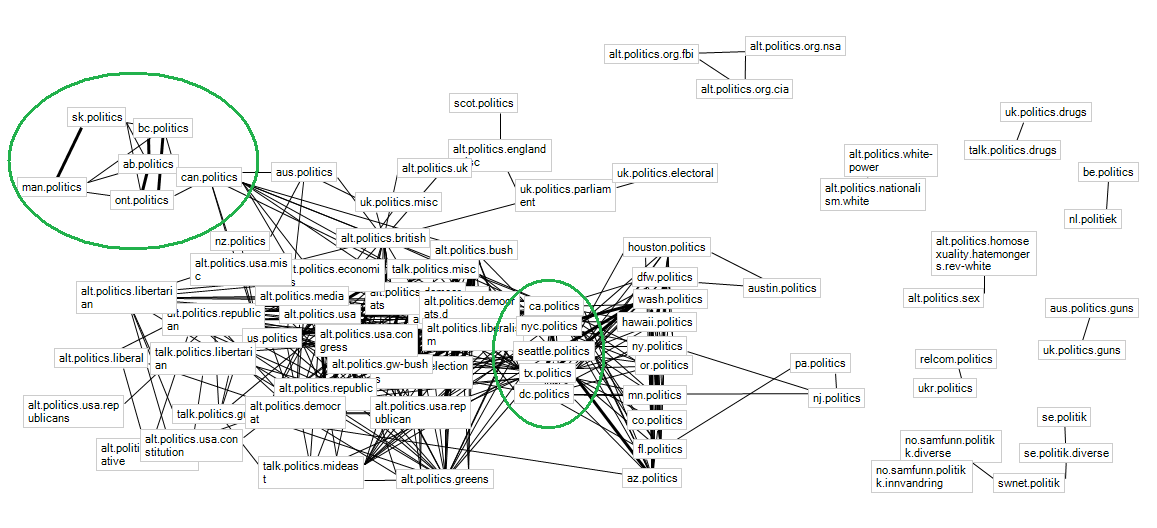
My apologies if this image messes with your RSS feed readers. It doesn't show up well on the main page, so go here for full view.

Using Marc Smith's .Netmap plug-in for excel, I visualized some data I had. These are shared authorships of political Usenet groups, based on Jaccard coefficient (similar to cosine similarity). A thin edge indicates a coefficient > 0.3, a thick edge indicates >0.5.

The alt.politics.* and talk.politics groups were a tangled mess that's nearly a clique, but there is some interesting behavior with local groups. In the top left are the Canadian local groups. Quebec's qc.politique doesn't appear at all in this graph (nodes are only visible if there is an edge associated), probably due to language barrier. Then, we have Saskatchewan and Manitoba connected with a thick edge, and British Columbia, Alberta, and Ontario connected with thick edges. Only the latter group is connected with can.politics, the general Canada group. Looking at the Canadian map it isn't regional since ONT is east of SK and MAN. However, there is something that does correlate the groups: population density. The group of three has a higher population, and a significantly higher population density, than the group of two. What comes with that is a higher-traffic local group, and more authors with which to share with even larger groups-- giving a higher coefficient.


The same thing may be happening with the US local groups, too. I've circled the "connected" US groups-- that is, the ones that share lots of authors with the alt.politics.* group. What's interesting is that these high-traffic groups form a bridge between alt.politics.* and the other local US groups. Several of these statewide, lower-traffic groups share authors amongst themselves, but with only a couple exceptions, they don't venture outside the local politics sphere. And again, there are some that don't show up here (most notably Virginia and Maryland-- I would imagine their nearest neighbor would be dc.politics, but they didn't have enough volume to get a high share-rate).

Just some cool-looking effects of the Jaccard index. I think another interesting way to visualize this might be to use a digraph, with an arrow from A to B if "p% of A's authors post in B". I bet that would get Virginia and Maryland to show up.

Monday, August 11, 2008

The end of Usenet?

In this post I put up some plots with the posting and linking rates in our political Usenet data set. Would the political Usenet continue to decline at the current linear rate (according to the past 4 years, and using a rough linear regression in R), the post rate would approach 0 around July 2014. Here is the (unsmoothed) data for posting rates, and the completely unoptimized linear fit in R.

Of course, it's safe to say that regressing on 4 years of data and projecting it 6 years into the future will leave a huge margin of error-- even the fit "looks" like it should be a little steeper. (Smoothed data gives the endtimes to occur a year earlier, and I imagine more sophisticated time series analysis would project something completely different.) Errors involved in fitting aside, there's no telling what other sorts of things could happen between now and then to bring it back or (perhaps more likely) speed its decline.

Saturday, August 9, 2008

What is Eliza crossed with a Magic 8 ball, times a billion?

I just got my weekend entertainment from http://bossy.appspot.com. It's an "ask" app inspired by Ask MSR, a paper written 7 years ago for TREC. (I'm not sure the authors ever intended or expected such a thing, but there it is.)

For 50 lines of API code, it's pretty impressive-- and when it's wrong it's usually entertaining. It does well on short and simple word-association queries, like "Who is Batman?" or "What is xkcd?", and seems to do reasonably well on easily-searchable names such as my own.

It even has some political opinions. Try "Who is the worst president in history?", "Who lost the 2004 election?", or "What is the United States?" and you'll get some cynical answers. It's also pacifist, at least for certain queries.

It tends to get snarky when asked other binary queries. I was chagrined when I asked it "Which is better, CMU or MIT?" It also defects when asked to decide between Microsoft and Google, or between OU and OSU. However, does have a preference with respect to the statistics cults.

Alas, it does not seem to be immune to spam.

Thursday, August 7, 2008

The male-female demographic in social media

Mike on Ads has a cool script to infer whether a user is male or female, based on browser history. If you have it analyze your history, it will give you a list of the sites you visited and the corresponding male:female ratio. He got the sites to poll from quantcast, but I can't tell if the demographics came from there as well. The numbers seem to be different when I plug them in, so I'm guessing he either used more/older data than what's currently up, or got it elsewhere.

Here are the ratios for various social media I plugged in, in order from "most male" to "most female":

Site M:F ratio
Digg 1.56
Flickr 1.15
Feedburner 1.11
Worldofwarcraft 1.08
Blogger 1.06
Youtube 1
Last.fm 0.96
Linkedin 0.94
Pandora 0.9
Facebook 0.83
Myspace 0.74
Livejournal 0.68

Twitter and Wikipedia didn't seem to be in the feature set. However, straight form quantcast it seems Twitter's ratio is 0.97 and Wikipedia's is 1.07. Quantcast also lists a ton of other demographic info, which is interesting to look at.

Monday, August 4, 2008

Memeorandum : Scandal : : Techmeme : ?

A few days ago, I posted that the top "most discussed" links on Memeorandum were related to scandal, violence, or both. Akshay suggested I do the same for Techmeme. His bid on the #1 discussed story was the Microsoft-Yahoo merger. For updates since September 2005, that turned out to be #2, and my bid, the Hans Reiser case, was nowhere close to the top.

So, what do Techmeme's sources *really* care about? Smartphones.

"Dear early adopters: Sorry we made iPhone available to the proles. Here's some iTunes. Love, Steve Jobs [smartphones] 152

Microsoft's bid for Yahoo! [acquisitions] 138

"Dear iTunes customers: No DRM-free music for you. Love, Steve Jobs [IP] 122

Macworld 2008 Keynote
[smartphones, gadgets] 121

Google announces Android [smartphones] 113

Digg tells DMCA to bug off
[IP] 112

Google on Microsoft's "hostile" bid for Yahoo! [acquisitions] 111

Google acquires Youtube [acquisitions] 107

Steve Jobs announces cheaper iPhone [smartphones] 104

Macworld 2007 (and announcement of the iPhone) [smartphones, gadgets] 101

Gadgets, with a smattering of IP and corporate bureaucracy. Spots 11-20 seem to be more of the same.

One thing that is worth noting is the "most discussed" story is a single link. So, if a number of news sites "split the vote" and have several discussion links apiece, the story may not surface in this list. With techmeme it is a little more obvious, since most bloggers seem to link to the official corporate press releases. With memeorandum, I'm trusting that preferential attachment (NYTimes and Washington Post dominate) makes it so the vote isn't split often enough to dramatically misrepresent reality.

Thursday, July 31, 2008

Telling us what we already know

Via Thursday Bram, communications agency Universal McCann recently conducted the third wave of their global study on social media usage. The results indicated, of course, a growing usage of all kinds of social media worldwide. Also, it notes that "blogs are a mainstream media worldwide and as a collective rival any traditional media" (emphasis mine). Sooner or later, it seems we'll have to be more specific when we say "mainstream media". :-)

You can see a complete slide show of results here. (Warning: It's very colorful, and people with a sensitivity to circles should not consume.) It should be useful for citing whenever a convincing intro to a SM research paper is needed.

What has been happening to the political Usenet?

When I first heard about the Netscan project (see Marc Smith's homepage), my thought was, "People still post on Usenet? Last I heard about it, one of the more active groups was alt.fan.spice-girls." Working on a related project, I've gotten a similar reaction from other people I've mentioned it to. So an overarching theme of my project has been to answer whether Usenet is a distinct community, or simply a sample of what we already know about online communication.

One advantage to studying Usenet is that since it's been around for so long, it's easy to get historical data and say something about its evolution. Furthermore, it's easier to call what we know of it a "community" (although we're still forced to sample it, for our purposes), whereas we never really know if we've crawled*all* the blogs.

What we have done so far is obtained data since 2003 for 200 newsgroups with "polit" somewhere in the newsgroup name. Here's some over-time behavior, a plot of number of posts per day, and number of hyperlinks (in original, non-quoted content) per day:


Posts and Links for All Political Newsgroups
This is a smoothed version of the data, so to illustrate a general trend. The first thing you'll notice is the bump in November 2004, which we can attribute to the US Presidential Election. The next thing you'll notice is that while the number of posts is declining, the number of links remains stable.

Here's the same data for a small subset, can.politics:

Posts and Links for can.politics

Predictably, the "USA Election bump" doesn't hold for all the groups. For uncultured folks like me who had to look it up, the last election in Canada was January 23, 2006. We do still notice an increasing tendency to link, per post. Perhaps people on Usenet are going more to outside sources. Or, as another intern put it, "They're getting lazy."

Tuesday, July 29, 2008

Scandal sells

Since starting at Live Labs I've gotten to play with a lot of data, including the political Usenet and crawled memeorandum hourly data (since mid-September 2005, following Katrina). Today I came across something less-than-surprising.

Top 10 links on memeorandum according to most number of 'discussion' links-- that is, number of discussions (usually blogged) that are related to a parent story (usually news).

"For McCain, Self-Confidence on Ethics Poses its Own Risk" [McCain and scandals] 219

"Spitzer is Linked to Prostitution Ring" 178

"Embattled Attorney General Resigns" [Gonzales and scandals] 170

[Text of Obama's race speech] 158

"NSA has massive database of Americans' phone calls" 129

"The Long Run-Up" [McCain and scandal] 119

"Craig Arrested, Pleads Guilty Following Incident in Airport Restroom" 116

"US Web Primer Is Said to Reveal a Nuclear Primer" [Iraq and Nukes] 115

"Digging Out More CNN/Youtube Plants" [Youtube politics and staged debates] 115

"Dark Suspicions About the NIE" [Iran and Nukes] 107

So, for the most part, what sells is sex and violence.