KDD this year put a lot of focus on social networks research. In addition to the long-running WebKDD, there was SNA-KDD (produced "Snack DD". Or at least it should be.) The Matrix and Tensor Methods workshop also included a paper featuring graph mining, and of course matrix methods in general are important for SNA. There were also two relevant tutorials I plan look over, now that I have the proceedings: Neville and Provost's Predictive Modeling with Social Networks, and Liu and Agrawal's "Blogosphere: Research Issues, Applications, and Tools."
And so far I've only listed SNA-related things going on first day. The Social Networks research track session was completely full: all seats taken, people crammed into the aisles, and overflowing into the hall. It was unfortunate that there were several people who just couldn't get in, but it was a lot of fun for the speakers to have such a great audience. There was also a panel on social networks, featuring Backstrom, Faloutsos, Jensen, and Leskovec. The conference took a cue from the overflowing session and switched it to a bigger room. (Unfortunately, it was scheduled at the same time as some other regular sessions that didn't receive the audience they might have were they only paired with other sessions.) There was an industry track session also devoted to social networks, and other relevant papers were in the Text Mining and Graph Mining sessions.
It's pretty exciting that social networks research is getting so much more attention, even in the last year. It will be interesting to see how long it lasts, and what sort of Big Questions get answered.
Time to board. It looks like the plane back to Seattle is mostly full of a different kind of geek: PAX attendees.
Wednesday, August 27, 2008
Tuesday, August 19, 2008
Butterflies in Vegas
I'd like to take this opportunity to self-promote our talk, "Weighted Graphs and Disconnected Components", at KDD 2008 next week in Las Vegas. This is work from CMU, with Leman Akoglu and Christos Faloutsos. In it we look at some commonly overlooked features of social networks: "disconnected components", or the components that are not connected to the largest connected component; and weighted edges, edges formed through repeated or valued interactions. We also propose the "Butterfly model" to generate graphs that match some of these new properties, along with previously-established graph properties.
For those planning to attend KDD, it will be the third in the Social Networks Research session, on Monday morning (with a poster Monday evening). Even if I haven't convinced you to attend our talk, you will want to see the other talks in the session (one of which is reviewed by Akshay Java here). They'll include the usual suspects from Yahoo! Research and Cornell, plus a paper analyzing of Sprint's call network. It should be a fascinating couple of hours!
For those planning to attend KDD, it will be the third in the Social Networks Research session, on Monday morning (with a poster Monday evening). Even if I haven't convinced you to attend our talk, you will want to see the other talks in the session (one of which is reviewed by Akshay Java here). They'll include the usual suspects from Yahoo! Research and Cornell, plus a paper analyzing of Sprint's call network. It should be a fascinating couple of hours!
Monday, August 18, 2008
Usenet vs blog linking in the 2004 election
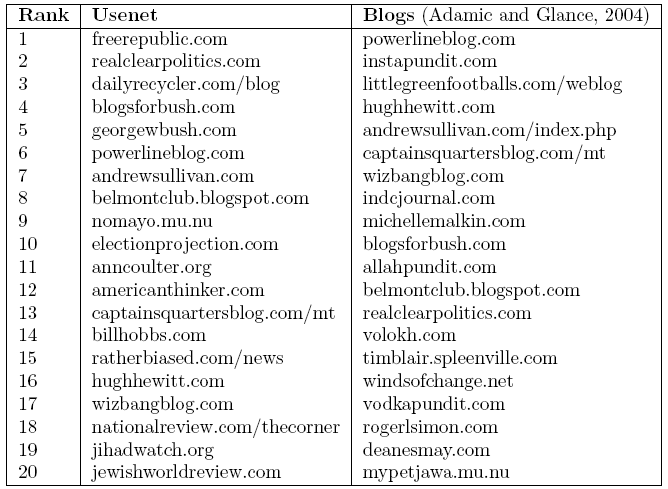
As a historical study, I've taken a subset of the political Usenet links and compared to blog links in the same time period. I took links from October-November 2004 and made "A lists" for both political and conservative blogs, and compared with the A-lists found by Adamic and Glance in 2004.
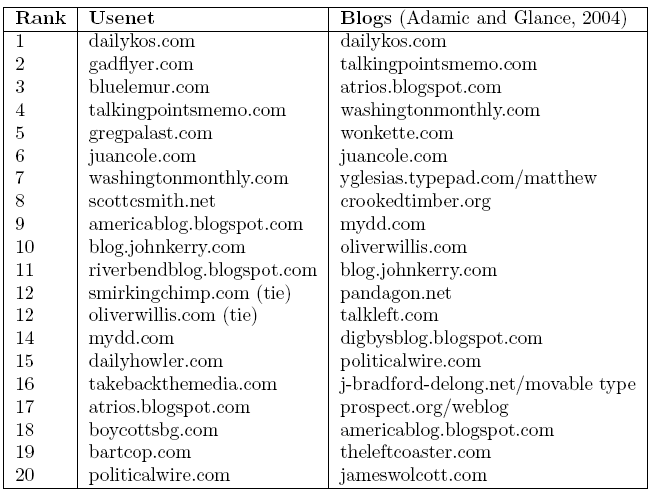
Liberal A-List
I did little in the way of pruning the list, while Adamic and Glance were careful to only include traditionally-formatted blogs, but I have removed ones they explicitly mentioned omitting. As in their study, I've left off drudgereport (originally #2 in conservative) and democraticunderground (originally #1 in liberal), as they were not "weblogs" in the traditional sense-- drudgereport is an aggregator and democraticunderground is a message board. freerepublic.com is also message board-like, so that might have warranted removal from the list as well, but it was not mentioned in the paper. Bluelemur also claims to be the liberal version of drudgereport, (ETA: and realclearpolitics is another news aggregator) so those might also have been eliminated from the original study. Gadflyer.com, #2 in Liberals, is no longer in existence, which is interesting in itself, considering its popularity just a few years ago. But it is also notably missing from the Blog A-list, either by the numbers or by classification.
It is perhaps curious that blog-message boards democraticunderground and freerepublic have topped both lists in Usenet, which is closer to message board format. I wonder where they actually ranked on the pre-pruned blog list.
My overall impression from looking at this data is that Usenet is "edgier"; we more commonly see conspiracy theories and wingers getting a lot of attention. Given that, and the apparent popularity of message-board-like blogs, I wonder if we could consider the Usenet to be even more "democratic" (or "ruled by the mob", to be more cynical) than blogs.
Conservative A-List
Liberal A-List
I did little in the way of pruning the list, while Adamic and Glance were careful to only include traditionally-formatted blogs, but I have removed ones they explicitly mentioned omitting. As in their study, I've left off drudgereport (originally #2 in conservative) and democraticunderground (originally #1 in liberal), as they were not "weblogs" in the traditional sense-- drudgereport is an aggregator and democraticunderground is a message board. freerepublic.com is also message board-like, so that might have warranted removal from the list as well, but it was not mentioned in the paper. Bluelemur also claims to be the liberal version of drudgereport, (ETA: and realclearpolitics is another news aggregator) so those might also have been eliminated from the original study. Gadflyer.com, #2 in Liberals, is no longer in existence, which is interesting in itself, considering its popularity just a few years ago. But it is also notably missing from the Blog A-list, either by the numbers or by classification.
It is perhaps curious that blog-message boards democraticunderground and freerepublic have topped both lists in Usenet, which is closer to message board format. I wonder where they actually ranked on the pre-pruned blog list.
My overall impression from looking at this data is that Usenet is "edgier"; we more commonly see conspiracy theories and wingers getting a lot of attention. Given that, and the apparent popularity of message-board-like blogs, I wonder if we could consider the Usenet to be even more "democratic" (or "ruled by the mob", to be more cynical) than blogs.
Thursday, August 14, 2008
Preferential Installation of Facebook Apps [SIGCOMM WOSN]
I'm reading over the proceedings of SIGCOMM's Workshop On Social Networks, which is in Seattle next Monday.
Minas Gjoka, Michael Sirivianos, Athina Markopoulou, and Xiaowei Yang, a team of authors at UCI, wrote a paper, Poking Facebook: Characterization of OSN Applications, which looks at data from Facebook application installation and use.
First, they seem to have gotten a pretty successful crawl, which is saying something since Facebook is pretty selfish with data. Here is a PDF of application installation, both according to facebook stats and their crawled dataset, which match up pretty well:
They also modeled the histogram of installed-apps-per-user as preferential, running a simulation with "users as bins" and different apps as "different colored balls", iteratively assigning balls to bins. For instance, saying that 100 users have installed the Zombies application, would translate to "gray balls appear in 100 bins".
For each iteration, one goes through each "ball" (application installation), starting with the "most popular color" (application with the most installations). For each ball one then assigns an additional "bin that doesn't already contain that color" (picks a new user that hasn't already installed the app) according to a probability:

Where balls(i) is the number of applications a user i has installed, and B is the set of users that hasn't already installed the application. init is a parameter to moderate the initial activity, and rho is the preferential exponent, chosen in simulations to be 1.6. In the end you get a sort of heavy-tailed behavior, with most users installing a couple apps and a few who go nuts with application installs. It fits pretty well:


One of the fun parts of these sort of data is the outliers-- the users who go nuts on something. (Netflix users rating thousands of movies, etc.) It looks like in the crawled data there are a few users with 500 apps installed!
In the paper there is also fit to the "coverage of applications"-- that is, how many of the ranked apps we need to go through before we have all the users with one of those apps installed, and it appears the simulation reaches coverage a little too quickly, so perhaps the most popular applications are taking too many users in the simulation.
What's somewhat surprising to me is that this isn't at all based on the behavior of a user's friends, but of the entire Facebook network at large. I suspect that in reality that does govern user behavior, but for large-scale patterns one can overlook it. This might be different for actually modeling how an application catches on. (Using other features like network effects are listed as "future work" for the authors in refining the model.)


Minas Gjoka, Michael Sirivianos, Athina Markopoulou, and Xiaowei Yang, a team of authors at UCI, wrote a paper, Poking Facebook: Characterization of OSN Applications, which looks at data from Facebook application installation and use.
First, they seem to have gotten a pretty successful crawl, which is saying something since Facebook is pretty selfish with data. Here is a PDF of application installation, both according to facebook stats and their crawled dataset, which match up pretty well:

They also modeled the histogram of installed-apps-per-user as preferential, running a simulation with "users as bins" and different apps as "different colored balls", iteratively assigning balls to bins. For instance, saying that 100 users have installed the Zombies application, would translate to "gray balls appear in 100 bins".
For each iteration, one goes through each "ball" (application installation), starting with the "most popular color" (application with the most installations). For each ball one then assigns an additional "bin that doesn't already contain that color" (picks a new user that hasn't already installed the app) according to a probability:

Where balls(i) is the number of applications a user i has installed, and B is the set of users that hasn't already installed the application. init is a parameter to moderate the initial activity, and rho is the preferential exponent, chosen in simulations to be 1.6. In the end you get a sort of heavy-tailed behavior, with most users installing a couple apps and a few who go nuts with application installs. It fits pretty well:

One of the fun parts of these sort of data is the outliers-- the users who go nuts on something. (Netflix users rating thousands of movies, etc.) It looks like in the crawled data there are a few users with 500 apps installed!
In the paper there is also fit to the "coverage of applications"-- that is, how many of the ranked apps we need to go through before we have all the users with one of those apps installed, and it appears the simulation reaches coverage a little too quickly, so perhaps the most popular applications are taking too many users in the simulation.
What's somewhat surprising to me is that this isn't at all based on the behavior of a user's friends, but of the entire Facebook network at large. I suspect that in reality that does govern user behavior, but for large-scale patterns one can overlook it. This might be different for actually modeling how an application catches on. (Using other features like network effects are listed as "future work" for the authors in refining the model.)
Tuesday, August 12, 2008
Shared authors in the political Usenet
My apologies if this image messes with your RSS feed readers. It doesn't show up well on the main page, so go here for full view.
Using Marc Smith's .Netmap plug-in for excel, I visualized some data I had. These are shared authorships of political Usenet groups, based on Jaccard coefficient (similar to cosine similarity). A thin edge indicates a coefficient > 0.3, a thick edge indicates >0.5.
The alt.politics.* and talk.politics groups were a tangled mess that's nearly a clique, but there is some interesting behavior with local groups. In the top left are the Canadian local groups. Quebec's qc.politique doesn't appear at all in this graph (nodes are only visible if there is an edge associated), probably due to language barrier. Then, we have Saskatchewan and Manitoba connected with a thick edge, and British Columbia, Alberta, and Ontario connected with thick edges. Only the latter group is connected with can.politics, the general Canada group. Looking at the Canadian map it isn't regional since ONT is east of SK and MAN. However, there is something that does correlate the groups: population density. The group of three has a higher population, and a significantly higher population density, than the group of two. What comes with that is a higher-traffic local group, and more authors with which to share with even larger groups-- giving a higher coefficient.
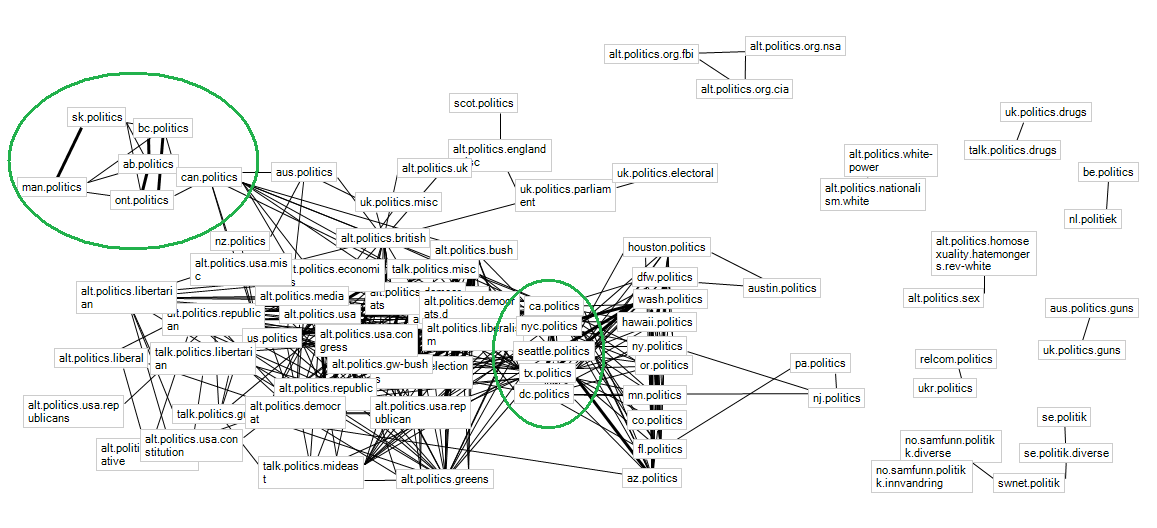
The same thing may be happening with the US local groups, too. I've circled the "connected" US groups-- that is, the ones that share lots of authors with the alt.politics.* group. What's interesting is that these high-traffic groups form a bridge between alt.politics.* and the other local US groups. Several of these statewide, lower-traffic groups share authors amongst themselves, but with only a couple exceptions, they don't venture outside the local politics sphere. And again, there are some that don't show up here (most notably Virginia and Maryland-- I would imagine their nearest neighbor would be dc.politics, but they didn't have enough volume to get a high share-rate).
Just some cool-looking effects of the Jaccard index. I think another interesting way to visualize this might be to use a digraph, with an arrow from A to B if "p% of A's authors post in B". I bet that would get Virginia and Maryland to show up.
Using Marc Smith's .Netmap plug-in for excel, I visualized some data I had. These are shared authorships of political Usenet groups, based on Jaccard coefficient (similar to cosine similarity). A thin edge indicates a coefficient > 0.3, a thick edge indicates >0.5.
The alt.politics.* and talk.politics groups were a tangled mess that's nearly a clique, but there is some interesting behavior with local groups. In the top left are the Canadian local groups. Quebec's qc.politique doesn't appear at all in this graph (nodes are only visible if there is an edge associated), probably due to language barrier. Then, we have Saskatchewan and Manitoba connected with a thick edge, and British Columbia, Alberta, and Ontario connected with thick edges. Only the latter group is connected with can.politics, the general Canada group. Looking at the Canadian map it isn't regional since ONT is east of SK and MAN. However, there is something that does correlate the groups: population density. The group of three has a higher population, and a significantly higher population density, than the group of two. What comes with that is a higher-traffic local group, and more authors with which to share with even larger groups-- giving a higher coefficient.
The same thing may be happening with the US local groups, too. I've circled the "connected" US groups-- that is, the ones that share lots of authors with the alt.politics.* group. What's interesting is that these high-traffic groups form a bridge between alt.politics.* and the other local US groups. Several of these statewide, lower-traffic groups share authors amongst themselves, but with only a couple exceptions, they don't venture outside the local politics sphere. And again, there are some that don't show up here (most notably Virginia and Maryland-- I would imagine their nearest neighbor would be dc.politics, but they didn't have enough volume to get a high share-rate).
Just some cool-looking effects of the Jaccard index. I think another interesting way to visualize this might be to use a digraph, with an arrow from A to B if "p% of A's authors post in B". I bet that would get Virginia and Maryland to show up.
Disney and CMU collaborate on graphics, pixie dust analysis
The newest resident to the Collaborative Innovation Center (CIC) on the CMU campus is the Disney Research Pittsburgh Lab, joining Google, Intel, and Apple Pittsburgh labs. This is, of course, pretty sweet.
One thing CMU has to navigate is a relative lack of nearby tech industry compared to schools on the coasts. Industry collaborations have not been a huge problem, as they can be done over long distance and CMU is very good at encouraging them through internships/sabbaticals. (Of course, having folks next door at the CIC makes things easier.) However, when it comes to tech-industry couples, it's always good to have more potential workplaces. Sometimes CMU doesn't have two faculty positions, or two grad student positions, etc. For more admin-type analysis, see post from CSD head Peter Lee at CSDiary.
CMU will collaborate with Disney Research Pittsburgh primarily on autonomous systems, graphics, and other entertainment technologies. Collaborations thus far have proved difficult, however, due to Donald Duck's frequent temper tantrums and insertion of nonsensical paragraphs into the text of papers. Also, Tigger keeps tearing up the lab equipment.
Monday, August 11, 2008
The end of Usenet?
In this post I put up some plots with the posting and linking rates in our political Usenet data set. Would the political Usenet continue to decline at the current linear rate (according to the past 4 years, and using a rough linear regression in R), the post rate would approach 0 around July 2014. Here is the (unsmoothed) data for posting rates, and the completely unoptimized linear fit in R.

Of course, it's safe to say that regressing on 4 years of data and projecting it 6 years into the future will leave a huge margin of error-- even the fit "looks" like it should be a little steeper. (Smoothed data gives the endtimes to occur a year earlier, and I imagine more sophisticated time series analysis would project something completely different.) Errors involved in fitting aside, there's no telling what other sorts of things could happen between now and then to bring it back or (perhaps more likely) speed its decline.

Of course, it's safe to say that regressing on 4 years of data and projecting it 6 years into the future will leave a huge margin of error-- even the fit "looks" like it should be a little steeper. (Smoothed data gives the endtimes to occur a year earlier, and I imagine more sophisticated time series analysis would project something completely different.) Errors involved in fitting aside, there's no telling what other sorts of things could happen between now and then to bring it back or (perhaps more likely) speed its decline.
Saturday, August 9, 2008
What is Eliza crossed with a Magic 8 ball, times a billion?
I just got my weekend entertainment from http://bossy.appspot.com. It's an "ask" app inspired by Ask MSR, a paper written 7 years ago for TREC. (I'm not sure the authors ever intended or expected such a thing, but there it is.)
For 50 lines of API code, it's pretty impressive-- and when it's wrong it's usually entertaining. It does well on short and simple word-association queries, like "Who is Batman?" or "What is xkcd?", and seems to do reasonably well on easily-searchable names such as my own.
It even has some political opinions. Try "Who is the worst president in history?", "Who lost the 2004 election?", or "What is the United States?" and you'll get some cynical answers. It's also pacifist, at least for certain queries.
It tends to get snarky when asked other binary queries. I was chagrined when I asked it "Which is better, CMU or MIT?" It also defects when asked to decide between Microsoft and Google, or between OU and OSU. However, does have a preference with respect to the statistics cults.
Alas, it does not seem to be immune to spam.
Thursday, August 7, 2008
The male-female demographic in social media
Mike on Ads has a cool script to infer whether a user is male or female, based on browser history. If you have it analyze your history, it will give you a list of the sites you visited and the corresponding male:female ratio. He got the sites to poll from quantcast, but I can't tell if the demographics came from there as well. The numbers seem to be different when I plug them in, so I'm guessing he either used more/older data than what's currently up, or got it elsewhere.
Here are the ratios for various social media I plugged in, in order from "most male" to "most female":
Site M:F ratio
Digg 1.56
Flickr 1.15
Feedburner 1.11
Worldofwarcraft 1.08
Blogger 1.06
Youtube 1
Last.fm 0.96
Linkedin 0.94
Pandora 0.9
Facebook 0.83
Myspace 0.74
Livejournal 0.68
Twitter and Wikipedia didn't seem to be in the feature set. However, straight form quantcast it seems Twitter's ratio is 0.97 and Wikipedia's is 1.07. Quantcast also lists a ton of other demographic info, which is interesting to look at.
Tuesday, August 5, 2008
How our brains deal with large numbers
Via Andrew Gelman, a recent Science article claims that humans innately use a logarithmic scale.
When I was a little kid my dad helped me "count to a million" using log scale (1,2,3...10,20,...100,200,...). Even then it seemed intuitive. I knew that there were increasingly more numbers in between counts as it got higher, and I felt I was "cheating" by skipping them, but I did not understand how long it truly would have taken if we'd counted all the numbers in between (I probably would have guessed it'd have taken hours, rather than days).
It's not that people cannot grasp large numbers-- they just have trouble converting back to a linear scale. :-)
When asked to point toward the correct location for a spoken number word onto a line segment labeled with 0 at left and 100 at right, even kindergarteners understand the task and behave nonrandomly, systematically placing smaller numbers at left and larger numbers at right. They do not distribute the numbers evenly, however, and instead devote more space to small numbers, imposing a compressed logarithmic mapping. For instance, they might place number 10 near the middle of the 0-to-100 segment.(Full text here, SciAm report here)
When I was a little kid my dad helped me "count to a million" using log scale (1,2,3...10,20,...100,200,...). Even then it seemed intuitive. I knew that there were increasingly more numbers in between counts as it got higher, and I felt I was "cheating" by skipping them, but I did not understand how long it truly would have taken if we'd counted all the numbers in between (I probably would have guessed it'd have taken hours, rather than days).
It's not that people cannot grasp large numbers-- they just have trouble converting back to a linear scale. :-)
Monday, August 4, 2008
Memeorandum : Scandal : : Techmeme : ?
A few days ago, I posted that the top "most discussed" links on Memeorandum were related to scandal, violence, or both. Akshay suggested I do the same for Techmeme. His bid on the #1 discussed story was the Microsoft-Yahoo merger. For updates since September 2005, that turned out to be #2, and my bid, the Hans Reiser case, was nowhere close to the top.
So, what do Techmeme's sources *really* care about? Smartphones.
"Dear early adopters: Sorry we made iPhone available to the proles. Here's some iTunes. Love, Steve Jobs [smartphones] 152
Microsoft's bid for Yahoo! [acquisitions] 138
"Dear iTunes customers: No DRM-free music for you. Love, Steve Jobs [IP] 122
Macworld 2008 Keynote [smartphones, gadgets] 121
Google announces Android [smartphones] 113
Digg tells DMCA to bug off [IP] 112
Google on Microsoft's "hostile" bid for Yahoo! [acquisitions] 111
Google acquires Youtube [acquisitions] 107
Steve Jobs announces cheaper iPhone [smartphones] 104
Macworld 2007 (and announcement of the iPhone) [smartphones, gadgets] 101
Gadgets, with a smattering of IP and corporate bureaucracy. Spots 11-20 seem to be more of the same.
One thing that is worth noting is the "most discussed" story is a single link. So, if a number of news sites "split the vote" and have several discussion links apiece, the story may not surface in this list. With techmeme it is a little more obvious, since most bloggers seem to link to the official corporate press releases. With memeorandum, I'm trusting that preferential attachment (NYTimes and Washington Post dominate) makes it so the vote isn't split often enough to dramatically misrepresent reality.
Feed experimentation
I'm attempting to redirect my default Blogger RSS feed to http://feeds.feedburner.com/dataphiles. Google Reader seems to take awhile to figure these things out, but if you don't see another post from me in the next week, you might check to make sure you're getting the right feed. Of course, given my history there's also some chance I just dropped off the face of the blogosphere, but we'll try to not let that happen.
Subscribe to:
Comments (Atom)